 Live Music Archive
 Librivox Free Audio
 Metropolitan Museum
 Cleveland Museum of Art
 Internet Arcade
 Console Living Room
 Books to Borrow
 Open Library
 TV News
 Understanding 9/11
tv [untitled] March 11, 2011 1:00am-1:30am PST
1:00 am
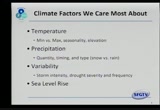
opposed to a maximum temperatures where we have seen not much of a trend. also the effects of elevation, these are very important to us. precipitation, that is our bread and butter. what form does it fall into a range versus no, how much of it falls? the timing of precipitation. these are critical factors that are engaged in such work. the variability is where our vulnerability is come. this includes drought, storm intensity. what is the severity of drought in the future? how much worse will storms get in the future? what will this mean for water quality? of course, there is a sea level rise. this is a critical factor for those of us along the coast.
1:01 am
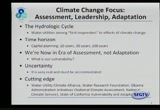
climate change affects the hydrological. precipitation, compensation. -- condensation. we are seen as first responders to the potential effect of climate change. our everyday work is bound up in the hydrological cycle. i'm going over not so much why we should care but how we should care about climate change, how we should approach evaluating the issue. we are approaching this on a timer rise in which matches up with the way we think. most apartments have capital programs. frequently, we think of capital improvement programs, large ones, as being on a 20-30 year time horizon.
1:02 am
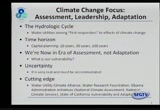
we are building those that will have a life cycle of a hundred years are more. -- or more. it matches well with the way we think and the way we plan to think about climate change in this way and this is what we are doing. i often say that we are in a time of assessments rather than adaptation to day and there are exceptions to that. i will talk about one of those today. the questions we are asking ourselves is what is our vulnerability? what is the effect of climate change? i will talk about why that is and how it plays out. one of the ways that to this plays out is the way to understand certainty. much of the work that we do and understating the potential impacts is bound up in uncertainty and a this is not the uncertainty that the climate the deniers in congress are talking about, although we have to be cognizant about confusing people. this is not uncertainty about
1:03 am
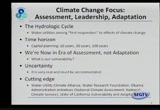
the fact that this is happening but what it means. when we look at outputs on climate change that we need to think about are the ranges, not simple values. we seeing on quantifiable probability. these are the extremes that we might see in the future. -- these are non quantifiable probabilities. this is one of the challenges that you will hear about again and again as you deal with the climate change issues. finally, we are approaching looking at climate change from a leadership position and being cutting edge at the state and local level. our general manager shares the water utility climate alliance which is one of the most important utilities focusing on climate change intensity. we have a number of other initiatives that we are engaged
1:04 am
in at the federal and state level. we think that these are important to do so that we understand what is happening out there while we are also making sure that we are focusing on our own operations and infrastructure and vulnerability. what i will do is focus in on a couple of key initiatives starting with the water enterprise. the first project i want to talk about is the pilot utility applications. we have made reference to this before. this is a national project with local implementation. it has five utilities from around the country, four size programs based where those regions exist and a modeling advisory committee made up of climate scientists and practitioners in the adaptation
1:05 am
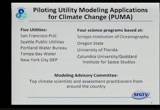
community that will help us proceed with this project. as this emerges from the work with the climate utility alliance. federal agencies who are really in the league in terms of public officials trying to deal with a lot of this. our fellow water providers, etc.. what became to is the idea that we need a state of the art assessment for each of us individually that is informative across the different regions. new york, san francisco, fla. learned from one another. each of our individual assessments bound together nationally in a way that will help us to do a state of the art assessment and learn as we go. that is what the project is about. starting at the top, what happened? that is down.
1:06 am
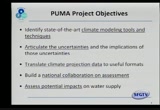
starting at the top of the models of the slide we presented in the past, what are the state of the art climate modeling tools and techniques which she used in any assessment? -- which we should use in any assessment? all models are wrong but some are useful. which ones are useful, which are more wrong than others, which should we use? not just blindly following the data that we get but as the assessment requires and looking at what that data tells us or does not tell us and incorporate this that we get from non modeling tools and using this in our assessment. we are moving forward with that aspect which i would say is the most difficult part of what we have to do in the project. we are understanding what these models tell us or don't tell us.
1:07 am
we will translate data that we get into a form that we can use in our downstream tools. the models that we use for the management of our system. we need to build a national collaboration and at the end of the day, we will assess the potential impact on our water supply. we have been working on building this for about a year and it will be at least a year before we have some answers. our official goal is to finish in 2011 and the unofficial goal is to get it in early 2012 because it will take a lot of different parts moving in intelligent well -- and intelligent ways for the first time. i'm hoping that we have some output on this in a year. one of the schools that we prol of our future projects -- one of
1:08 am
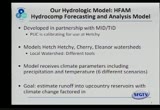
the tools that we will have in this project and for all of our future projects is this model. we are nearing completion on calibration of our model. hydrology models are models of the physical processes that occur and the watershed, things like soil moisture infiltration, a separation. they tell you what the stream flow will be. they received as and put things like precipitation entablature. they allow us to change precipitation to accommodate some hypothetical future under climate change scenarios so we can evaluate the effect of those potential futures on runoff. that is step one in
1:09 am
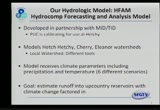
understanding the water supply impact as we discussed. other factors that it can't receive includes wind and solar radiation that can have effects different than solar radiation. this is fairly complex. leveraging a lot of the work that the district did in developing this model first, working with it for 10 years and then with us, in the first phase of our calibration effort. we invested in tweaking the model so it reproduced the past hydrology using past information as much as possible. we've leveraged 10-years of work that was done as well the project that we done and we have taken over the calibration ourselves in the water enterprise and are on the edge of finishing the project right now to give us a model that we think will be wrong but useful in terms of predicting what happens in the watershed when precipitation and temperature
1:10 am
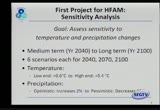
and other factors change. part of the calibration project is to conduct a sensitivity analysis of our systems. the sensitivity of inflow to changes in precipitation and temperature primarily that we think we will see potentially or hypothetically from climate change. this is not a climate change projection. this is a sensitivity analysis that looks at low end prediction for temperature increases, high and predictions for temperature increases, low-end predictions for temperature changes. up -- for precipitation changes. then high and changes on the negative side to create a set of scenarios. this ends up being 18 different
1:11 am
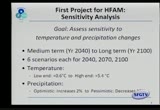
parings of temperature and precipitation change. what that will do is bound for us the range of potential effects that we will see if any of those scenarios for to come true. on the worst and, you have a 5.4 degree temperature increase which is about 9 degrees fahrenheit. this is pretty significant. this is the top and temperature change which was reported in 2007. we will see if that changes in the future. at the high-end, we factored in a decrease in precipitation of 15%. at the end of the day, we will get that worst-case scenario and a best case scenario, with 0.6 degrees celsius and an increase of 2%. it will tell us where we need to worry. what do we need to worry about if things come true in terms of
1:12 am
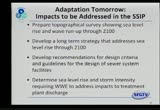
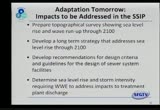
the inflow? this is not a water supply analysis, however. to get to water supply, you have to take the next step down, take the inflow, then we need to model our local water system. 15% of the water that falls as rain into our system. obviously, there is no snow pack their but what is the effect of rain antipater? we need to run this through our operations model to tell us what the potential impact on water supply would be. this is a step by step process. it will end with the operations modeling and an assessment of what our potential supply impact would be. that is what the project will use using climate modeling output of that represents the state of the science. that is what the sensitivity
1:13 am
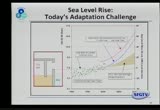
analysis will began to do for inflow. we will see where we go after we get that information on the shorter term. that is water. let's talk about wastewater enterprise initiatives. if there is one thing that moves us from assessment to adaptation, it is sea level rise, especially as we live along the coast. the sea level predictions are only going in one direction. we have already seen a sea level increase in the past year. in san francisco, a little bit can make a big difference. going through this slide -- >> 8 inches in the past year? >> no, the last century. >> i would have noticed that. >> no, that would be alarming. >> 3 millimeters a year right now. sorry. the parallel line right here is
1:14 am

-- we will talk about the vulnerability of the storm water collection system which we have done before this commission. we will talk about how the salt water can get into the collections system and compromise our treatment processes. the orange line is the uppermost -- the lower level of the storm water collection system along the bay. this is the pay level. when water goes over these, they kick into the transport storage box which leads to transplant. it can compromise the treatment processes. the green dots, those are annual peak times over the last century. you can see how they are going out. the sea level is increasing. this is important because this is the highest level of the
1:15 am
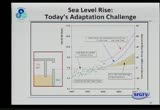
year. what we have seen in the collections system is seven or 8 overflows per year over the last several years. we know that that will only get worse as the sea level rises further. we know that the inundation of the sea water into the storm water collection system will only become more frequent and potentially become a problem. this is something that we need to address. this will become more of a problem, of course, but these are the sea level rise curves from the literature. this is 7-23 inches. this is the peak level which is adopted by the state. this is a 100 year tide level which would make that the frequency of flooding even more frequent.
1:16 am
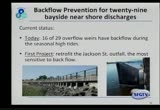
this will be seeing much more in this area and you will see more flow into the systems and this is a problem. this is a problem we are addressing with the prevention program. we are doing an analysis at 29 points along the bay which are vulnerable to or have seen inundation into the water system because of high tides washington. we have talked about installing these in the past. this would allow water to go out and stop water from going in. this is the most sensitive to backflow. we are looking at how to dress back flow into the outflow at jackson street as the first design priority. this is adaptation. when i do my public speaking, i frequently talk about while we are in a year of assessment,
1:17 am
that is not the only story. there are those who are planning on investing in preventing the effects of climate change which we know are coming. this is a good example of that. in the long term, the commission has approved levels of services which includes the goal of modifying the system to adapt to the effects of climate change. this will be focused on that as was mentioned by doing a number of things including a topographical survey and looking at where inundation might take place at different levels of sea level rise we might see at what kind of designer strategies we should take -- design strategies we should take. what is the basis for the long- term strategy on sea level rise and the potential on the ocean side? that might be important for creating resilience for our system. from a climate change
1:18 am
perspective, done carefully and correctly, caught the scent of the sites and what it tells us today and what it does not tell us today, wheat can be innovators in innovating this from a climate change perspective. you don't have that many opportunities to incorporate climate change into a long term capital planning. we should focus on rainfall intensity. this is a very difficult thing to study. this is a trend that we will see greater rainfall intensity. we can do that. we are investing a lot of money in rebuilding systems. >> before you move on, i had a
1:19 am
couple of questions on that. the rainfall intensity question, i am hoping that the discussions and planning that it can be in the context of climate change. we don't always remember that climate change is an overriding subjects that we should be paying attention to as we are designing our system. we want to keep water out of the system but of that intensity and using models, this would be very helpful. >> let me comment on the models. this is something that we spent some time on the plumas project. this was just 435 operators among the five utilities. the advances are that we were looking at the intensity modeling question as opposed to long-term tenant -- trends in temperature and precipitation that the water business people care most about. this is for seattle, new york,
1:20 am
and ask for the members of the alliance. the short answer was not really or not yet. the models are not sophisticated enough to deal at the temper of scale and the spatial scale that we think about. these are numbers of meters and members of minutes. modeling at a five-minute interval, 15 minutes, we would have a lot of wastewater utilities. that does not mean that the size does not say anything of value. we are trying to evaluate the climate models.
1:21 am

what we understand about what the systems and el nino, to qualitatively see how these might play out in the future. we can put this in the context of what the climate models say. there is data, we have to look at every piece of data that we have today. during the planning phase, this is an improvement program and we went back and look at seven years' worth of data. we will see these in the bayside system. i have come up with a plan that we revisit every five years. we are looking at a storm intensity surge.
1:22 am

>> i am glad that at work is ongoing because i do think that the adaptation peace moves us forward, the better. we know what is coming and some of this is already happening. you did not mention anything about our actual facilities in the southeast treatment. both of those are pretty low- line as well. -- low-lying as well. >> this does factoring and looking at new facilities that will be in place for 5200 years. we are looking at many different aspects. we are looking at one that was considered which was a likelihood of flooding. we are looking at areas which would be inundated with in the foreseeable future up to 55 inches but we have 2100 to 55
1:23 am
inches because when you're building a permanent facility that we are depending on to treat our waste water, we would prefer it would be there. we do consider that when we are citing a facility. this would be a challenge as well >> with that end up on the pier? >> we have not got to that point and it would be some type of creative challenge. >> they are more interested in levees at treasure island. >> what is the salinization fitting into this -- where does desalinization fit into this? >> there are strategies for water providers, especially in the west. those things seem to be
1:24 am
approaches that make us less reliant on water falling from the sky or from flows in a river. we all know over the last 30 years -- >> where are we with that? >> as a new member, i don't know -- >> we have people that can answer this much better than i can. >> we are working with the park district and the disability -- municipality district on a regional project where we are evaluating establishing the project across the county that we can share to define what can be produced from that facility to determine if this is cost- effective. we completed a call it -- a pilot project last year.
1:25 am
we are looking at what this could mean for us and other entities across the area. >> when i was a junk assembly man, this is an area that i was very -- when i was a young assembly man, this was an area that i was very interested in. this was because of the cost and not the nature of the technology. we have no reports that indicate what the cost efficiency will be at this point. >> we have different reports which have been coming down over the years -- which shows that the cost efficiency has been coming down over the years. as membrane technology has include -- has improved, the cost has come down. this is competitive with other water sources out there. >> this is a priority for the puc?
1:26 am
>> yes. >> i would be happy to receive more reading material on this area. >> maybe there is an appropriate calendar because i and stand that i am getting into a deep conversation honest. -- on this. maybe we can hear from energy on this topic. there is another issue related to climate change where it is my understanding that once salt water gets into the system, it is difficult to get it out, to neutralize or to treat it wants is in the system. >> this compromises the -- that the plant depends on.
1:27 am
if we don't do anything, this would be a potential problem. >> are there other technologies that can assist with this? >> getting the salt water out of the system t -- of the system? >> part of the operational strategy is that we don't pump from a certain area. we must circulate or di;ute what is coming in. -- dilute what is coming in. as it moves higher and is coming in in multiple locations, we have to have a better plan. >> thank you. >> anything else on the waste water? thank you.
1:28 am
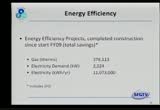
>> energy efficiency projects have move forward which have resulted in savings. goo>> we are trying to get rid f the closed captioning on the front screen. >> in terms of saving on the gas side, in terms of production, 2200. in terms of electricity generated were saved through efficiency, 11 million or more kilowatt hours per year. these have been moving forward says the last report to the commission. on the renewable side, but we have the sunset that has been completed and a number of other
1:29 am
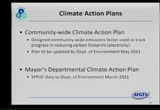
projects are under way. that adds up to the total kilowatts saved. this is reducing our car and foot print. this is making a major contribution to the accomplishment of our climate action plans. one is focused on everything within the borders of san francisco. this has set a goal of reducing our carbon footprint. we have made a significant contribution to the accounting process related to that by providing a community-wide emissions factor and understanding how this contributes to meeting this goal. this plan is being updated by the department of the environment and terms of where we are doing this. then there is the department of climate action plan which focuses in on energy use department by department
83 Views
IN COLLECTIONS
SFGTV: San Francisco Government Television Television Archive
  Television Archive News Search Service
Uploaded by TV Archive on
